Compare commits
27 Commits
| Author | SHA1 | Date |
|---|---|---|
|
|
fd5af3c685 | |
|
|
654099f310 | |
|
|
e9538e60df | |
|
|
cb93e79e52 | |
|
|
306019cf6a | |
|
|
394758bd73 | |
|
|
ef1c12b2d1 | |
|
|
075db46b66 | |
|
|
5a8dc2ea4a | |
|
|
e73e92c3ef | |
|
|
d32370cf8a | |
|
|
aac0a8bf0d | |
|
|
0e56133da7 | |
|
|
2834fa6c59 | |
|
|
d5448477c3 | |
|
|
0911d83de9 | |
|
|
ccf9ca044b | |
|
|
737eac7066 | |
|
|
8e666d3dec | |
|
|
16ae304ef7 | |
|
|
a495f6b217 | |
|
|
639d7e07e0 | |
|
|
76b51db49e | |
|
|
6bb5fcce57 | |
|
|
a3bc6fd307 | |
|
|
0410329791 | |
|
|
b02cfef370 |
|
|
@ -6,8 +6,8 @@ SET (PROJECT_LOWERCASE_NAME "cairo-chart")
|
|||
SET (PROJECT_DESCRIPTION "GtkChart for Gtk.DrawingArea (Cairo).")
|
||||
|
||||
SET (MAJOR 0)
|
||||
SET (MINOR 1)
|
||||
SET (PATCH 1)
|
||||
SET (MINOR 2)
|
||||
SET (PATCH 0)
|
||||
|
||||
LIST (APPEND CMAKE_MODULE_PATH ${CMAKE_SOURCE_DIR}/cmake/backbone)
|
||||
|
||||
|
|
|
|||
17
README.md
17
README.md
|
|
@ -8,13 +8,14 @@ Git: https://git.backbone.ws/gtk/cairo-chart
|
|||
|
||||
## View YouTube movie
|
||||
|
||||
[](https://www.youtube.com/watch?v=wmZAw2csjQg)
|
||||
[](https://www.youtube.com/watch?v=GpnObfofqYI)
|
||||
|
||||
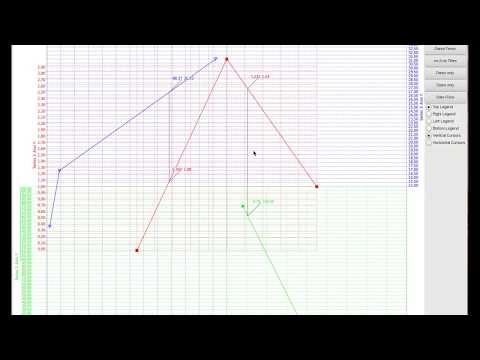
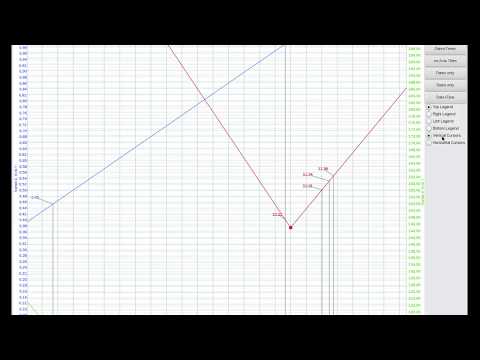
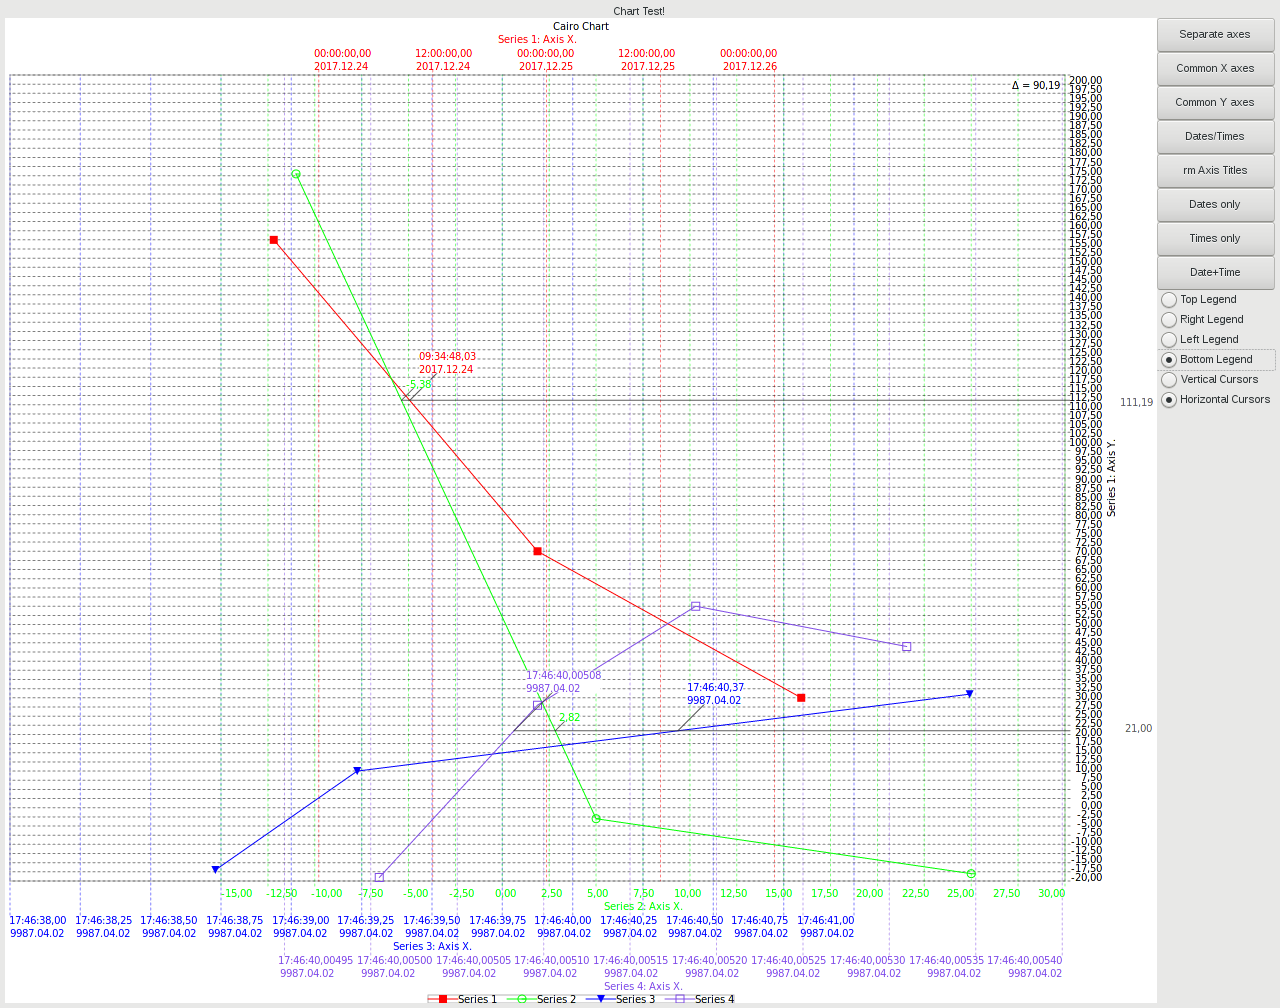
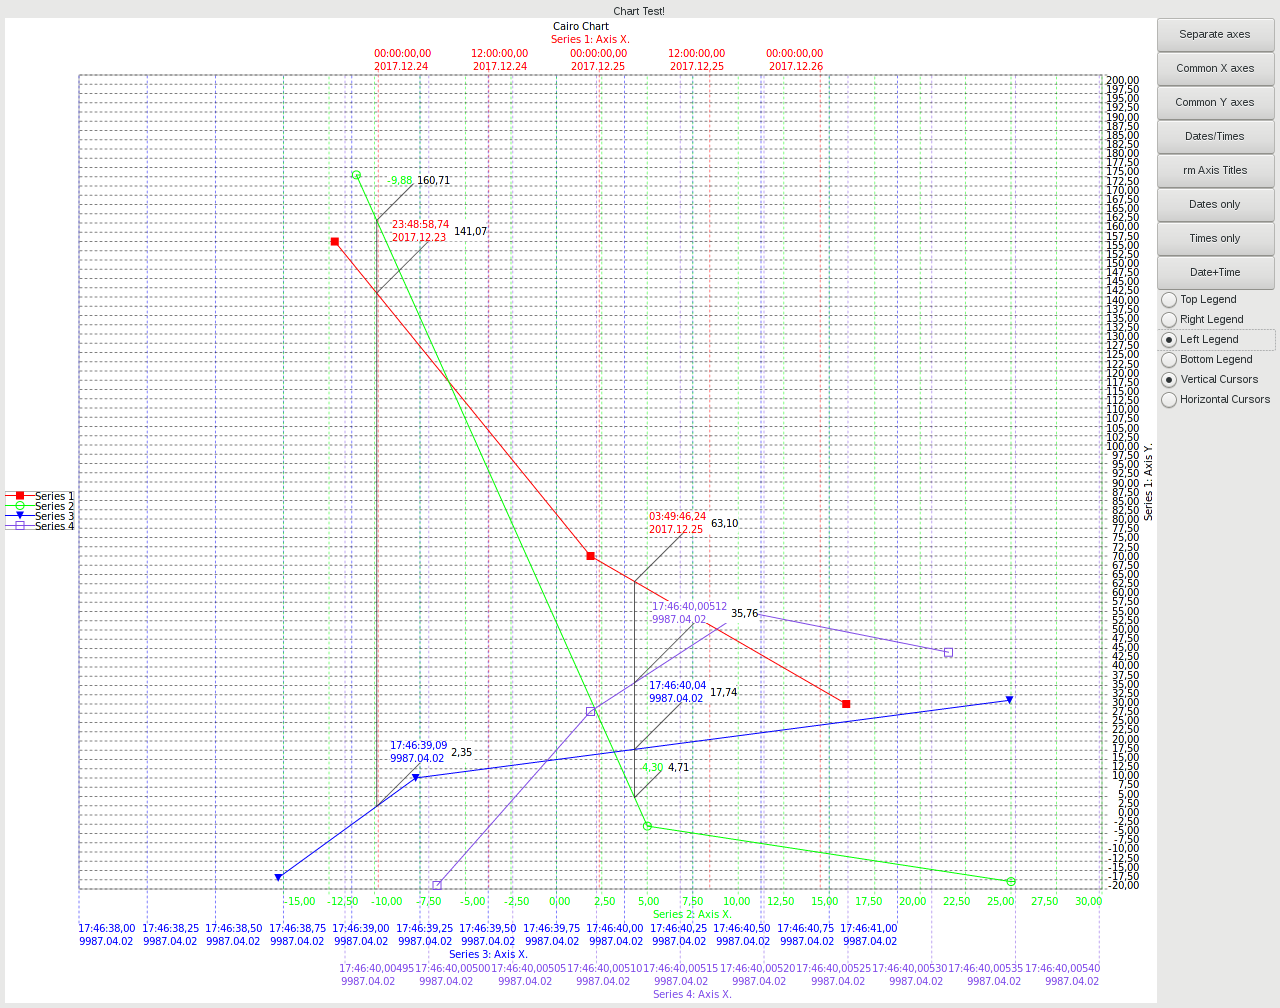
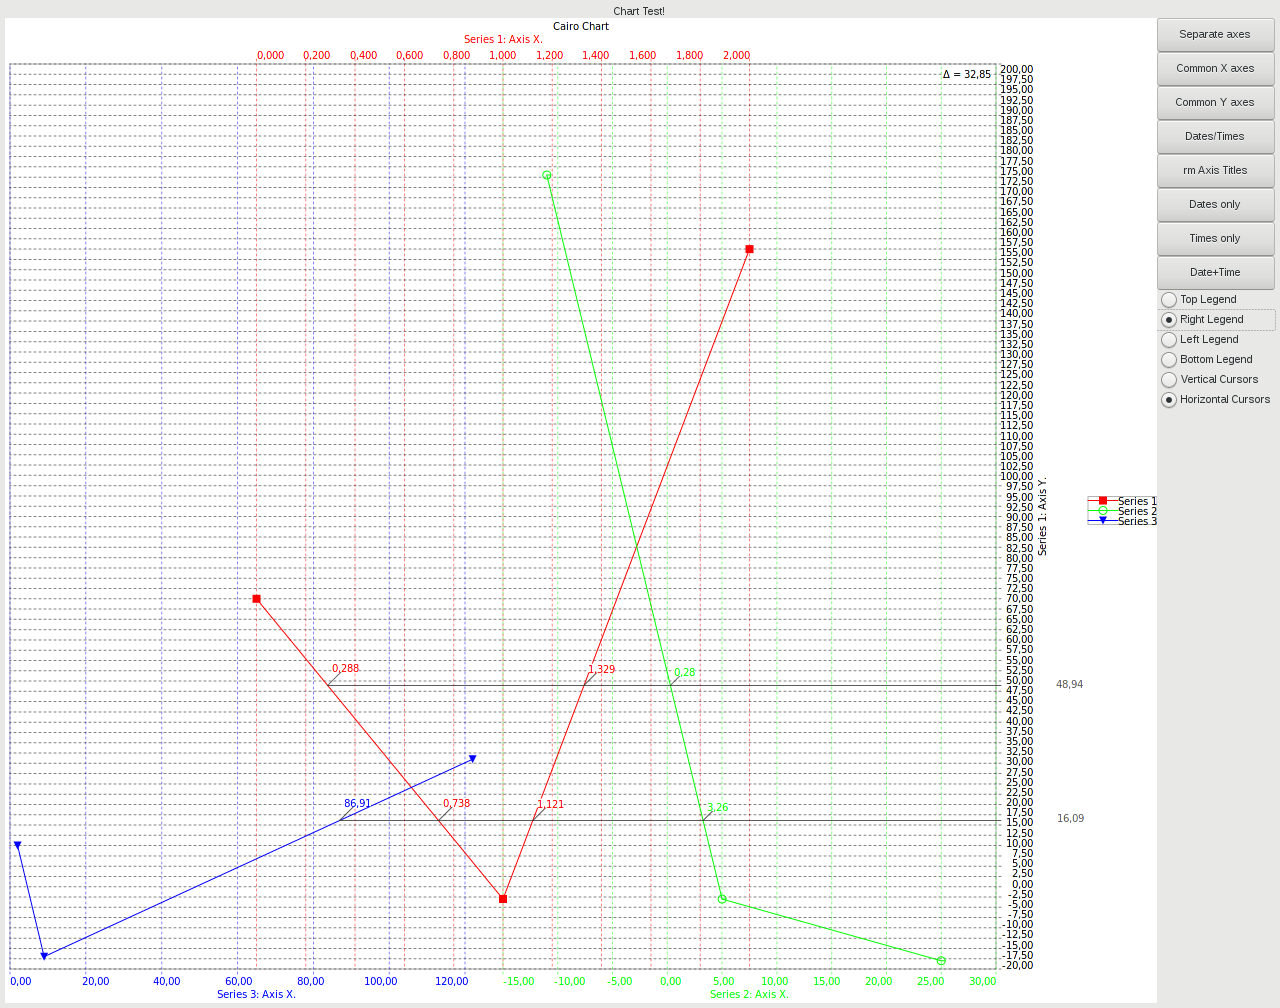
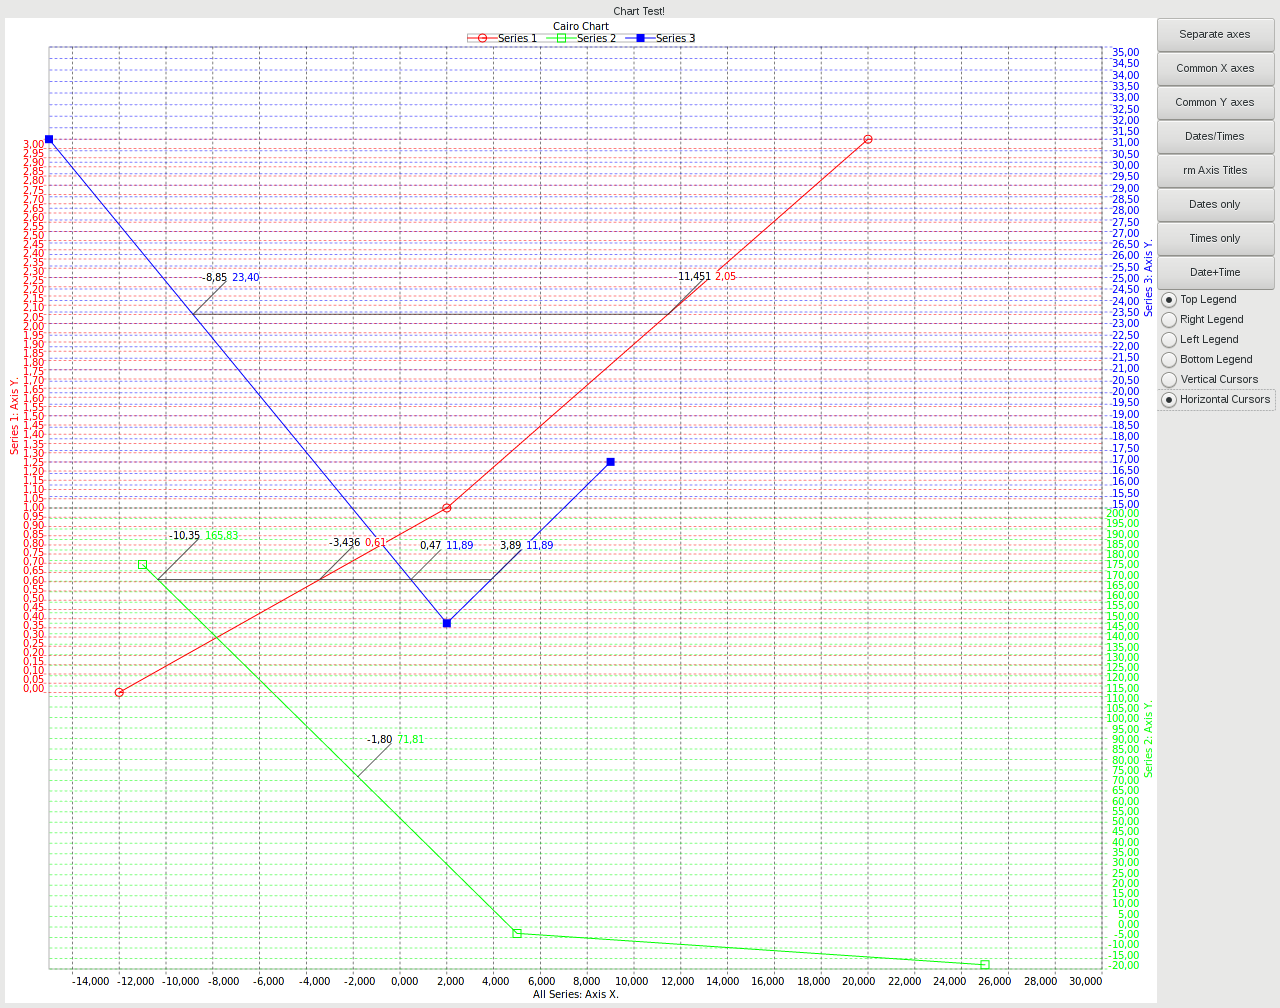
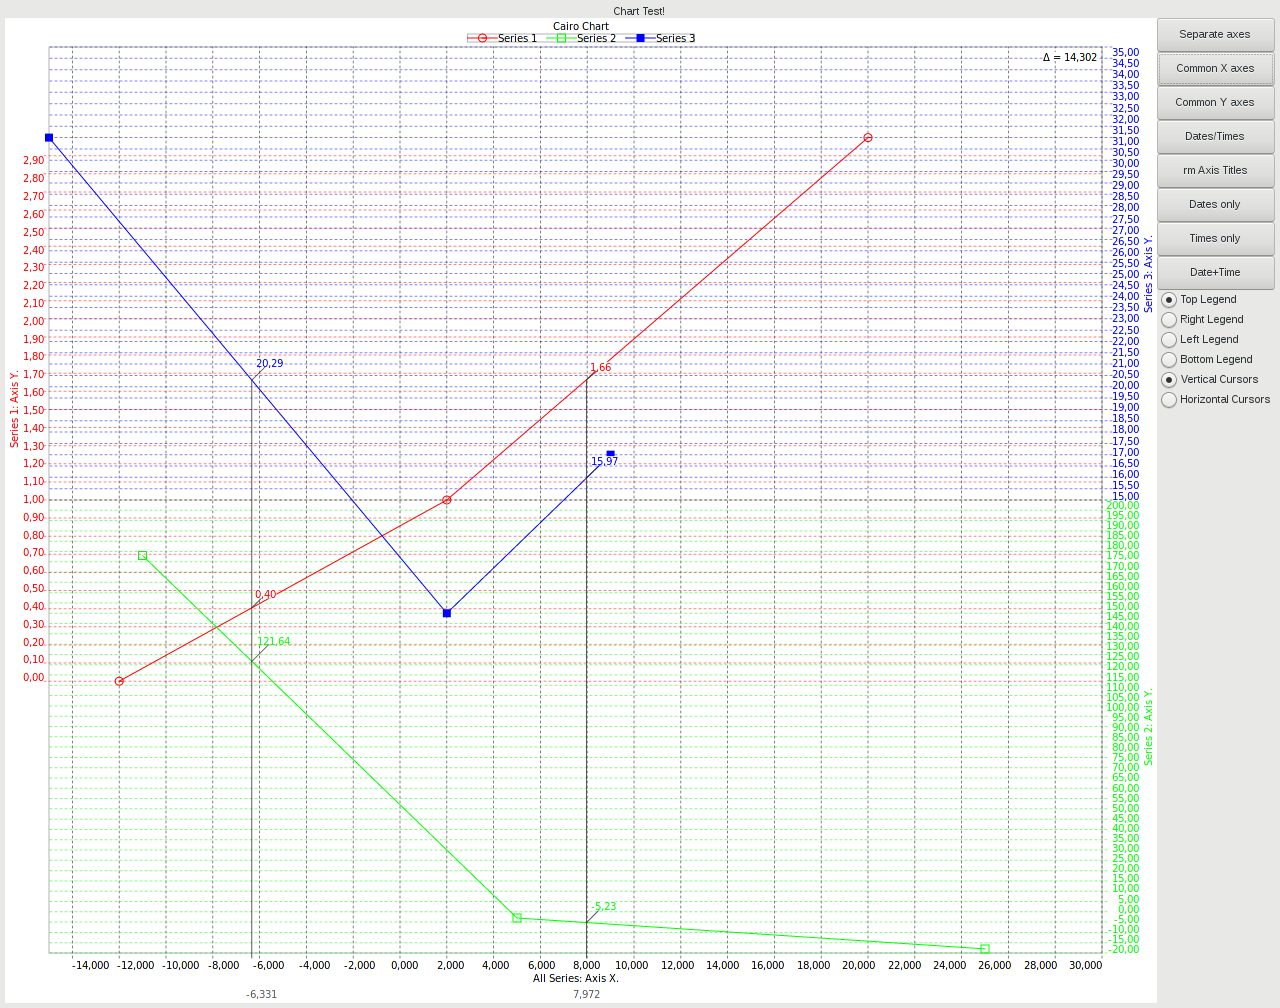
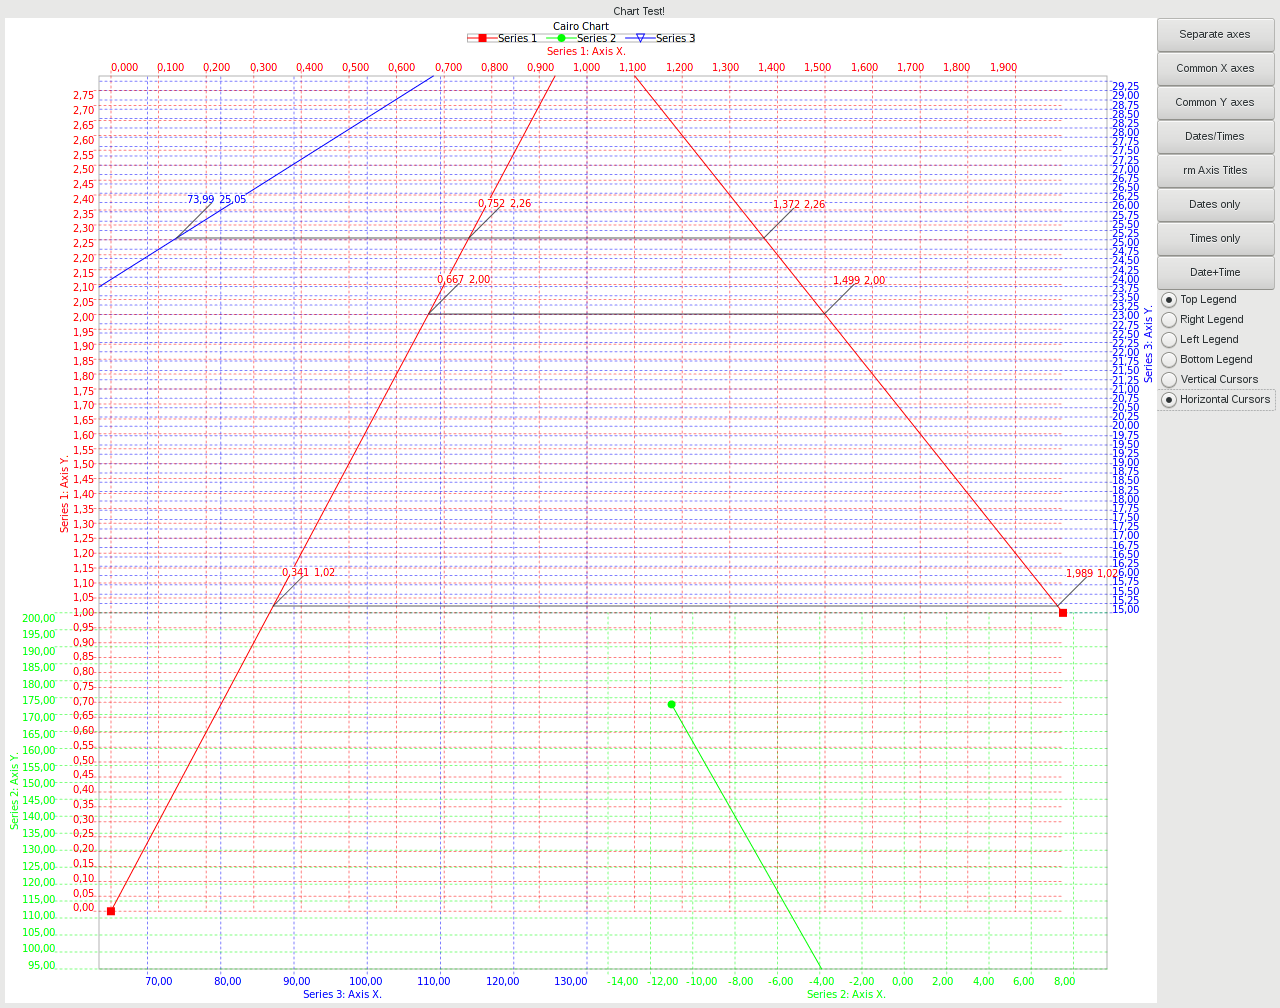
## Screenshots
|
||||
|
||||
|
||||
|
||||
|
||||
|
||||
|
||||
|
||||
|
||||
|
||||
|
||||
|
||||

|
||||
|
||||
|
||||
|
||||
|
|
|
|||
|
|
@ -1 +1 @@
|
|||
Subproject commit 5aec8e830a52e88f61c8844ac15dca72b1ef7f06
|
||||
Subproject commit 9ba1995060ebb1c65ac9855e3671b3992c859059
|
||||
113
src/Axis.vala
113
src/Axis.vala
|
|
@ -156,12 +156,12 @@ namespace CairoChart {
|
|||
/**
|
||||
* ``Axis`` line style.
|
||||
*/
|
||||
public LineStyle grid_style = LineStyle (Color(), 1, {2, 3});
|
||||
public LineStyle grid_style = LineStyle(Color(0, 0, 0, 0.25)); // Color(), 1, {2, 3});
|
||||
|
||||
/**
|
||||
* Number of equally placed points to evaluate records sizes.
|
||||
*/
|
||||
public int nrecords = 128;
|
||||
public int nrecords = 8;
|
||||
|
||||
/**
|
||||
* Constructs a new ``Axis``.
|
||||
|
|
@ -250,7 +250,7 @@ namespace CairoChart {
|
|||
}
|
||||
|
||||
/**
|
||||
* Draws horizontal axis.
|
||||
* Draws axis.
|
||||
* @param nskip number of series to skip printing.
|
||||
*/
|
||||
public virtual void draw (ref int nskip) {
|
||||
|
|
@ -305,6 +305,40 @@ namespace CairoChart {
|
|||
}
|
||||
}
|
||||
|
||||
var max_rec_spacing = 2 * (is_x ? font.vspacing : font.hspacing);
|
||||
var max_title_width = title.text == "" ? 0 : title.width + font.hspacing;
|
||||
var max_title_height = title.text == "" ? 0 : title.height + font.vspacing;
|
||||
|
||||
var dx = max_rec_width + max_rec_spacing + max_title_width;
|
||||
var dy = max_rec_height + max_rec_spacing + max_title_height;
|
||||
chart.evarea.x0 -= dx; chart.evarea.x1 += dx; chart.evarea.y0 -= dy; chart.evarea.y1 += dy;
|
||||
|
||||
if (nskip != 0)
|
||||
--nskip;
|
||||
else {
|
||||
var max_rec_height_all = max_rec_height;
|
||||
var max_rec_width_all = max_rec_width;
|
||||
if (is_x)
|
||||
join_rel_axes (si, true, ref max_rec_width_all, ref max_rec_height_all, ref max_rec_spacing, ref max_title_height, ref nskip);
|
||||
else
|
||||
join_rel_axes (si, true, ref max_rec_width_all, ref max_rec_height_all, ref max_rec_spacing, ref max_title_width, ref nskip);
|
||||
|
||||
if (is_x && (!chart.joint_x || si == chart.zoom_1st_idx)) {
|
||||
var tmp = max_rec_height_all + max_rec_spacing + max_title_height;
|
||||
switch (position) {
|
||||
case Position.LOW: chart.evarea.y1 -= tmp; break;
|
||||
case Position.HIGH: chart.evarea.y0 += tmp; break;
|
||||
}
|
||||
}
|
||||
if (!is_x && (!chart.joint_y || si == chart.zoom_1st_idx)) {
|
||||
var tmp = max_rec_width_all + max_rec_spacing + max_title_width;
|
||||
switch (position) {
|
||||
case Position.LOW: chart.evarea.x0 += tmp; break;
|
||||
case Position.HIGH: chart.evarea.x1 -= tmp; break;
|
||||
}
|
||||
}
|
||||
}
|
||||
|
||||
// 4.5. Draw Axis title
|
||||
if (title.text != "") {
|
||||
if (is_x) {
|
||||
|
|
@ -339,26 +373,9 @@ namespace CairoChart {
|
|||
if (is_x) draw_recs (min, step, max_rec_height);
|
||||
else draw_recs (min, step, max_rec_width);
|
||||
|
||||
chart.evarea.x0 += dx; chart.evarea.x1 -= dx; chart.evarea.y0 += dy; chart.evarea.y1 -= dy;
|
||||
|
||||
chart.ctx.stroke ();
|
||||
|
||||
var tmp1 = 0.0, tmp2 = 0.0, tmp3 = 0.0, tmp4 = 0.0;
|
||||
join_rel_axes (si, false, ref tmp1, ref tmp2, ref tmp3, ref tmp4, ref nskip);
|
||||
|
||||
if (nskip != 0) {--nskip; return;}
|
||||
|
||||
var tmp = 0.0;
|
||||
if (is_x) tmp = max_rec_height + font.vspacing + (title.text == "" ? 0 : title.height + font.vspacing);
|
||||
else tmp = max_rec_width + font.hspacing + (title.text == "" ? 0 : title.width + font.hspacing);
|
||||
switch (position) {
|
||||
case Position.LOW:
|
||||
if (is_x) chart.evarea.y1 -= tmp;
|
||||
else chart.evarea.x0 += tmp;
|
||||
break;
|
||||
case Position.HIGH:
|
||||
if (is_x) chart.evarea.y0 += tmp;
|
||||
else chart.evarea.x1 -= tmp;
|
||||
break;
|
||||
}
|
||||
}
|
||||
|
||||
/**
|
||||
|
|
@ -366,30 +383,29 @@ namespace CairoChart {
|
|||
* @param nskip returns number of series to skip printing.
|
||||
*/
|
||||
public virtual void join_axes (ref int nskip) {
|
||||
Axis axis = this;
|
||||
if (!ser.zoom_show) return;
|
||||
if (nskip != 0) {--nskip; return;}
|
||||
var max_rec_width = 0.0, max_rec_height = 0.0;
|
||||
calc_rec_sizes (axis, out max_rec_width, out max_rec_height, is_x);
|
||||
var max_font_spacing = is_x ? axis.font.vspacing : axis.font.hspacing;
|
||||
var max_axis_font_width = axis.title.text == "" ? 0 : axis.title.width + axis.font.hspacing;
|
||||
var max_axis_font_height = axis.title.text == "" ? 0 : axis.title.height + axis.font.vspacing;
|
||||
calc_rec_sizes (this, out max_rec_width, out max_rec_height, is_x);
|
||||
var max_rec_spacing = 2 * (is_x ? font.vspacing : font.hspacing);
|
||||
var max_title_width = title.text == "" ? 0 : title.width + font.hspacing;
|
||||
var max_title_height = title.text == "" ? 0 : title.height + font.vspacing;
|
||||
|
||||
var si = Math.find_arr<Series>(chart.series, ser);
|
||||
if (si == -1) return;
|
||||
|
||||
if (is_x)
|
||||
join_rel_axes (si, true, ref max_rec_width, ref max_rec_height, ref max_font_spacing, ref max_axis_font_height, ref nskip);
|
||||
join_rel_axes (si, true, ref max_rec_width, ref max_rec_height, ref max_rec_spacing, ref max_title_height, ref nskip);
|
||||
else
|
||||
join_rel_axes (si, true, ref max_rec_width, ref max_rec_height, ref max_font_spacing, ref max_axis_font_width, ref nskip);
|
||||
join_rel_axes (si, true, ref max_rec_width, ref max_rec_height, ref max_rec_spacing, ref max_title_width, ref nskip);
|
||||
|
||||
// for 4.2. Cursor values for joint X axis
|
||||
if (si == chart.zoom_1st_idx && chart.cursors.has_crossings) {
|
||||
switch (chart.cursors.style.orientation) {
|
||||
case Cursors.Orientation.VERTICAL:
|
||||
if (is_x && chart.joint_x) {
|
||||
var tmp = max_rec_height + axis.font.vspacing;
|
||||
switch (axis.position) {
|
||||
var tmp = max_rec_height + font.vspacing;
|
||||
switch (position) {
|
||||
case Position.LOW: chart.plarea.y1 -= tmp; break;
|
||||
case Position.HIGH: chart.plarea.y0 += tmp; break;
|
||||
}
|
||||
|
|
@ -407,14 +423,14 @@ namespace CairoChart {
|
|||
}
|
||||
}
|
||||
if (is_x && (!chart.joint_x || si == chart.zoom_1st_idx)) {
|
||||
var tmp = max_rec_height + max_font_spacing + max_axis_font_height;
|
||||
switch (axis.position) {
|
||||
var tmp = max_rec_height + max_rec_spacing + max_title_height;
|
||||
switch (position) {
|
||||
case Position.LOW: chart.plarea.y1 -= tmp; break;
|
||||
case Position.HIGH: chart.plarea.y0 += tmp; break;
|
||||
}
|
||||
}
|
||||
if (!is_x && (!chart.joint_y || si == chart.zoom_1st_idx)) {
|
||||
var tmp = max_rec_width + max_font_spacing + max_axis_font_width;
|
||||
var tmp = max_rec_width + max_rec_spacing + max_title_width;
|
||||
switch (position) {
|
||||
case Position.LOW: chart.plarea.x0 += tmp; break;
|
||||
case Position.HIGH: chart.plarea.x1 -= tmp; break;
|
||||
|
|
@ -429,8 +445,8 @@ namespace CairoChart {
|
|||
switch (axis.dtype) {
|
||||
case DType.NUMBERS:
|
||||
var text = new Text (chart, axis.format.printf((LongDouble)x) + (horizontal ? "_" : ""), axis.font);
|
||||
max_rec_width = double.max (max_rec_width, text.width);
|
||||
max_rec_height = double.max (max_rec_height, text.height);
|
||||
max_rec_width = double.max (max_rec_width, text.width + 2 * text.font.hspacing);
|
||||
max_rec_height = double.max (max_rec_height, text.height + 2 * text.font.vspacing);
|
||||
break;
|
||||
case DType.DATE_TIME:
|
||||
string date, time;
|
||||
|
|
@ -439,12 +455,12 @@ namespace CairoChart {
|
|||
var h = 0.0;
|
||||
if (axis.date_format != "") {
|
||||
var text = new Text (chart, date + (horizontal ? "_" : ""), axis.font);
|
||||
max_rec_width = double.max (max_rec_width, text.width);
|
||||
max_rec_width = double.max (max_rec_width, text.width + 2 * text.font.hspacing);
|
||||
h = text.height;
|
||||
}
|
||||
if (axis.time_format != "") {
|
||||
var text = new Text (chart, time + (horizontal ? "_" : ""), axis.font);
|
||||
max_rec_width = double.max (max_rec_width, text.width);
|
||||
max_rec_width = double.max (max_rec_width, text.width + 2 * text.font.hspacing);
|
||||
h += text.height;
|
||||
}
|
||||
max_rec_height = double.max (max_rec_height, h);
|
||||
|
|
@ -457,8 +473,8 @@ namespace CairoChart {
|
|||
bool calc_max_values,
|
||||
ref double max_rec_width,
|
||||
ref double max_rec_height,
|
||||
ref double max_font_spacing,
|
||||
ref double max_axis_font_size,
|
||||
ref double max_rec_spacing,
|
||||
ref double max_title_size,
|
||||
ref int nskip) {
|
||||
for (int sj = si - 1; sj >= 0; --sj) {
|
||||
var s2 = chart.series[sj];
|
||||
|
|
@ -481,11 +497,13 @@ namespace CairoChart {
|
|||
calc_rec_sizes (a2, out tmp_max_rec_width, out tmp_max_rec_height, is_x);
|
||||
max_rec_width = double.max (max_rec_width, tmp_max_rec_width);
|
||||
max_rec_height = double.max (max_rec_height, tmp_max_rec_height);
|
||||
max_font_spacing = double.max (max_font_spacing, is_x ? a2.font.vspacing : a2.font.hspacing);
|
||||
max_axis_font_size = double.max (max_axis_font_size,
|
||||
a2.title.text == "" ? 0
|
||||
: is_x ? a2.title.height + font.vspacing
|
||||
: a2.title.width + font.hspacing);
|
||||
max_rec_spacing = double.max (max_rec_spacing, 2 * (is_x ? a2.font.vspacing : a2.font.hspacing));
|
||||
max_title_size = double.max (
|
||||
max_title_size,
|
||||
a2.title.text == "" ? 0
|
||||
: is_x ? a2.title.height + font.vspacing
|
||||
: a2.title.width + font.hspacing
|
||||
);
|
||||
}
|
||||
++nskip;
|
||||
} else {
|
||||
|
|
@ -498,8 +516,9 @@ namespace CairoChart {
|
|||
for (Float128 v = min; Math.point_belong (v, min, range.zmax); v += step) {
|
||||
if (is_x && chart.joint_x || !is_x && chart.joint_y) {
|
||||
chart.color = chart.joint_color;
|
||||
ser.axis_x.grid_style.color = Color(0, 0, 0, 0.5);
|
||||
ser.axis_y.grid_style.color = Color(0, 0, 0, 0.5);
|
||||
grid_style.color.red = chart.joint_color.red;
|
||||
grid_style.color.green = chart.joint_color.green;
|
||||
grid_style.color.blue = chart.joint_color.blue;
|
||||
} else
|
||||
chart.color = color;
|
||||
string text = "", time_text = ""; var time_text_t = new Text(chart); var crpt = 0.0;
|
||||
|
|
|
|||
|
|
@ -45,6 +45,11 @@ namespace CairoChart {
|
|||
*/
|
||||
public LineStyle selection_style = LineStyle ();
|
||||
|
||||
/**
|
||||
* Zoom Scroll speed.
|
||||
*/
|
||||
public double zoom_scroll_speed = 64.0;
|
||||
|
||||
/**
|
||||
* Plot area bounds.
|
||||
*/
|
||||
|
|
@ -182,7 +187,7 @@ namespace CairoChart {
|
|||
}
|
||||
|
||||
/**
|
||||
* Zooms the ``Chart``.
|
||||
* Zooms in the ``Chart``.
|
||||
* @param area selected zoom area.
|
||||
*/
|
||||
public virtual void zoom_in (Area area) {
|
||||
|
|
@ -262,6 +267,8 @@ namespace CairoChart {
|
|||
public virtual void move (Point delta) {
|
||||
var d = delta;
|
||||
|
||||
if (plarea.width.abs() < 1 || plarea.height.abs() < 1) return;
|
||||
|
||||
d.x /= -plarea.width; d.y /= -plarea.height;
|
||||
|
||||
var z = zoom.copy();
|
||||
|
|
@ -277,13 +284,10 @@ namespace CairoChart {
|
|||
|
||||
d.x *= z.width; d.y *= z.height;
|
||||
|
||||
var px1 = plarea.x1;
|
||||
var py1 = plarea.y1;
|
||||
|
||||
if (x0 + d.x < plarea.x0) d.x = plarea.x0 - x0;
|
||||
if (x1 + d.x > px1) d.x = px1 - x1;
|
||||
if (x1 + d.x > plarea.x1) d.x = plarea.x1 - x1;
|
||||
if (y0 + d.y < plarea.y0) d.y = plarea.y0 - y0;
|
||||
if (y1 + d.y > py1) d.y = py1 - y1;
|
||||
if (y1 + d.y > plarea.y1) d.y = plarea.y1 - y1;
|
||||
|
||||
zoom_in(
|
||||
new Area.with_rel(
|
||||
|
|
@ -295,6 +299,52 @@ namespace CairoChart {
|
|||
);
|
||||
}
|
||||
|
||||
/**
|
||||
* Zooms in the ``Chart`` by event point (scrolling).
|
||||
* @param p event position.
|
||||
*/
|
||||
public virtual void zoom_scroll_in (Point p) {
|
||||
var w = plarea.width, h = plarea.height;
|
||||
if (w < 8 || h < 8) return;
|
||||
zoom_in (
|
||||
new Area.with_abs(
|
||||
plarea.x0 + (p.x - plarea.x0) / w * zoom_scroll_speed,
|
||||
plarea.y0 + (p.y - plarea.y0) / h * zoom_scroll_speed,
|
||||
plarea.x1 - (plarea.x1 - p.x) / w * zoom_scroll_speed,
|
||||
plarea.y1 - (plarea.y1 - p.y) / h * zoom_scroll_speed
|
||||
)
|
||||
);
|
||||
}
|
||||
|
||||
/**
|
||||
* Zooms out the ``Chart`` by event point (scrolling).
|
||||
* @param p event position.
|
||||
*/
|
||||
public virtual void zoom_scroll_out (Point p) {
|
||||
var z = zoom.copy(), pa = plarea.copy();
|
||||
var w = plarea.width, h = plarea.height;
|
||||
if (w < 8 || h < 8) return;
|
||||
|
||||
zoom_out();
|
||||
|
||||
var x0 = plarea.x0 + plarea.width * z.x0;
|
||||
var x1 = plarea.x0 + plarea.width * z.x1;
|
||||
var y0 = plarea.y0 + plarea.height * z.y0;
|
||||
var y1 = plarea.y0 + plarea.height * z.y1;
|
||||
|
||||
var dx0 = (p.x - pa.x0) / w * zoom_scroll_speed;
|
||||
var dx1 = (pa.x1 - p.x) / w * zoom_scroll_speed;
|
||||
var dy0 = (p.y - pa.y0) / h * zoom_scroll_speed;
|
||||
var dy1 = (pa.y1 - p.y) / h * zoom_scroll_speed;
|
||||
|
||||
if (x0 - dx0 < plarea.x0) x0 = plarea.x0; else x0 -= dx0;
|
||||
if (x1 + dx1 > plarea.x1) x1 = plarea.x1; else x1 += dx1;
|
||||
if (y0 - dy0 < plarea.y0) y0 = plarea.y0; else y0 -= dy0;
|
||||
if (y1 + dy1 > plarea.y1) y1 = plarea.y1; else y1 += dy1;
|
||||
|
||||
zoom_in (new Area.with_abs(x0, y0, x1, y1));
|
||||
}
|
||||
|
||||
protected virtual void fix_evarea () {
|
||||
if (evarea.width < 0) evarea.width = 0;
|
||||
if (evarea.height < 0) evarea.height = 0;
|
||||
|
|
@ -330,13 +380,6 @@ namespace CairoChart {
|
|||
|
||||
protected virtual void eval_plarea () {
|
||||
plarea = evarea.copy();
|
||||
if (legend.show)
|
||||
switch(legend.position) {
|
||||
case Legend.Position.TOP: plarea.y0 += legend.spacing; break;
|
||||
case Legend.Position.BOTTOM: plarea.y1 -= legend.spacing; break;
|
||||
case Legend.Position.LEFT: plarea.x0 += legend.spacing; break;
|
||||
case Legend.Position.RIGHT: plarea.x1 -= legend.spacing; break;
|
||||
}
|
||||
|
||||
// Check for joint axes
|
||||
joint_x = joint_y = true;
|
||||
|
|
@ -357,8 +400,8 @@ namespace CairoChart {
|
|||
}
|
||||
|
||||
protected virtual void draw_plarea_border () {
|
||||
LineStyle().apply(this);
|
||||
color = border_color;
|
||||
ctx.set_dash(null, 0);
|
||||
ctx.rectangle(plarea.x0, plarea.y0, plarea.width, plarea.height);
|
||||
ctx.stroke ();
|
||||
}
|
||||
|
|
@ -370,9 +413,9 @@ namespace CairoChart {
|
|||
title.show();
|
||||
}
|
||||
protected virtual void draw_axes () {
|
||||
for (var si = series.length - 1, nskip = 0; si >=0; --si)
|
||||
for (var si = series.length - 1, nskip = 0; si >= 0; --si)
|
||||
series[si].axis_x.draw(ref nskip);
|
||||
for (var si = series.length - 1, nskip = 0; si >=0; --si)
|
||||
for (var si = series.length - 1, nskip = 0; si >= 0; --si)
|
||||
series[si].axis_y.draw(ref nskip);
|
||||
}
|
||||
protected virtual void draw_series () {
|
||||
|
|
|
|||
113
src/Cursor.vala
113
src/Cursor.vala
|
|
@ -60,6 +60,11 @@ namespace CairoChart {
|
|||
*/
|
||||
public Style style = Style();
|
||||
|
||||
/**
|
||||
* Value label style.
|
||||
*/
|
||||
public LabelStyle label_style = new LabelStyle();
|
||||
|
||||
/**
|
||||
* Has crossings.
|
||||
*/
|
||||
|
|
@ -82,6 +87,7 @@ namespace CairoChart {
|
|||
c.active_cursor = active_cursor;
|
||||
c.is_cursor_active = is_cursor_active;
|
||||
c.style = style;
|
||||
c.label_style = label_style.copy();
|
||||
c.crossings = crossings;
|
||||
return c;
|
||||
}
|
||||
|
|
@ -340,9 +346,18 @@ namespace CairoChart {
|
|||
var show_time = ccs[ci].show_time;
|
||||
var show_y = ccs[ci].show_y;
|
||||
|
||||
chart.color = chart.bg_color;
|
||||
// value label background
|
||||
chart.color = label_style.bg_color;
|
||||
chart.ctx.rectangle (svp.x - size.x / 2, svp.y - size.y / 2, size.x, size.y);
|
||||
chart.ctx.fill();
|
||||
// value label frame
|
||||
label_style.frame_style.apply(chart);
|
||||
chart.ctx.move_to (svp.x - size.x / 2, svp.y - size.y / 2);
|
||||
chart.ctx.rel_line_to (size.x, 0);
|
||||
chart.ctx.rel_line_to (0, size.y);
|
||||
chart.ctx.rel_line_to (-size.x, 0);
|
||||
chart.ctx.rel_line_to (0, -size.y);
|
||||
chart.ctx.stroke();
|
||||
|
||||
if (show_x) {
|
||||
chart.color = s.axis_x.color;
|
||||
|
|
@ -416,7 +431,7 @@ namespace CairoChart {
|
|||
if (Math.vcross(s.scr_pnt(points[i]), s.scr_pnt(points[i+1]), rel2scr_x(c.x),
|
||||
chart.plarea.y0, chart.plarea.y1, out y)) {
|
||||
var point = Point128(s.axis_x.axis_val(rel2scr_x(c.x)), s.axis_y.axis_val(y));
|
||||
Point128 size; bool show_x, show_date, show_time, show_y;
|
||||
Point size; bool show_x, show_date, show_time, show_y;
|
||||
cross_what_to_show(s, out show_x, out show_time, out show_date, out show_y);
|
||||
calc_cross_sizes (s, point, out size, show_x, show_time, show_date, show_y);
|
||||
Cross cc = {si, point, size, show_x, show_date, show_time, show_y};
|
||||
|
|
@ -428,7 +443,7 @@ namespace CairoChart {
|
|||
if (Math.hcross(s.scr_pnt(points[i]), s.scr_pnt(points[i+1]),
|
||||
chart.plarea.x0, chart.plarea.x1, rel2scr_y(c.y), out x)) {
|
||||
var point = Point128(s.axis_x.axis_val(x), s.axis_y.axis_val(rel2scr_y(c.y)));
|
||||
Point128 size; bool show_x, show_date, show_time, show_y;
|
||||
Point size; bool show_x, show_date, show_time, show_y;
|
||||
cross_what_to_show(s, out show_x, out show_time, out show_date, out show_y);
|
||||
calc_cross_sizes (s, point, out size, show_x, show_time, show_date, show_y);
|
||||
Cross cc = {si, point, size, show_x, show_date, show_time, show_y};
|
||||
|
|
@ -449,7 +464,7 @@ namespace CairoChart {
|
|||
protected struct Cross {
|
||||
uint series_index;
|
||||
Point128 point;
|
||||
Point128 size;
|
||||
Point size;
|
||||
bool show_x;
|
||||
bool show_date;
|
||||
bool show_time;
|
||||
|
|
@ -478,14 +493,90 @@ namespace CairoChart {
|
|||
return all_cursors;
|
||||
}
|
||||
|
||||
protected virtual void scr2cell (int m, int n, Point p, out int i, out int j) {
|
||||
i = (int)((p.x - chart.plarea.x0) / chart.plarea.width * m);
|
||||
j = (int)((p.y - chart.plarea.y0) / chart.plarea.height * n);
|
||||
}
|
||||
|
||||
protected virtual void cell2scr (int m, int n, int i, int j, out Point p) {
|
||||
p = Point(chart.plarea.x0 + chart.plarea.width * (i + 0.5) / m,
|
||||
chart.plarea.y0 + chart.plarea.height * (j + 0.5)/ n);
|
||||
}
|
||||
|
||||
protected virtual void calc_cursors_value_positions () {
|
||||
// 1. Find maximum width/height of cursors values.
|
||||
var max_width = 1.0, max_height = 1.0;
|
||||
for (var ccsi = 0, max_ccsi = crossings.length; ccsi < max_ccsi; ++ccsi) {
|
||||
for (var cci = 0, max_cci = crossings[ccsi].crossings.length; cci < max_cci; ++cci) {
|
||||
unowned Cross[] cr = crossings[ccsi].crossings;
|
||||
max_width = double.max(max_width, cr[cci].size.x
|
||||
+ 4 * double.max(chart.series[cr[cci].series_index].axis_x.font.hspacing,
|
||||
chart.series[cr[cci].series_index].axis_y.font.hspacing));
|
||||
max_height = double.max(max_height, cr[cci].size.y
|
||||
+ 4 * double.max(chart.series[cr[cci].series_index].axis_x.font.vspacing,
|
||||
chart.series[cr[cci].series_index].axis_y.font.vspacing));
|
||||
}
|
||||
}
|
||||
|
||||
// 2. Calculate 2D-array sizes.
|
||||
var m = (int.max(1, (int)(chart.plarea.width / max_width))),
|
||||
n = (int.max(1, (int)(chart.plarea.height / max_height)));
|
||||
|
||||
// 3. Create 2D-array of bool or links to cursors values.
|
||||
var arr2d_e = new bool[m, n];
|
||||
|
||||
// 4. Set Busy/Cross Cells
|
||||
for (var ccsi = 0, max_ccsi = crossings.length; ccsi < max_ccsi; ++ccsi) {
|
||||
for (var cci = 0, max_cci = crossings[ccsi].crossings.length; cci < max_cci; ++cci) {
|
||||
// TODO: Ticket #142: find smart algorithm of cursors values placements
|
||||
unowned Cross[] cr = crossings[ccsi].crossings;
|
||||
cr[cci].scr_point = chart.series[cr[cci].series_index].scr_pnt (cr[cci].point);
|
||||
var d_max = double.max (cr[cci].size.x / 1.5, cr[cci].size.y / 1.5);
|
||||
cr[cci].scr_value_point = Point (cr[cci].scr_point.x + d_max, cr[cci].scr_point.y - d_max);
|
||||
int i = 0, j = 0;
|
||||
scr2cell(m, n, cr[cci].scr_point, out i, out j);
|
||||
arr2d_e[i, j] = true;
|
||||
}
|
||||
}
|
||||
|
||||
// 5. Calculate positions.
|
||||
for (var ccsi = 0, max_ccsi = crossings.length; ccsi < max_ccsi; ++ccsi) {
|
||||
for (var cci = 0, max_cci = crossings[ccsi].crossings.length; cci < max_cci; ++cci) {
|
||||
unowned Cross[] cr = crossings[ccsi].crossings;
|
||||
int i = 0, j = 0;
|
||||
scr2cell(m, n, cr[cci].scr_point, out i, out j);
|
||||
for (var radius = 1; radius < int.max(m, n); ++radius) {
|
||||
bool found = false;
|
||||
|
||||
// top, bottom
|
||||
int[] ll = {int.max(0, j - radius), int.min(n - 1, j + radius)};
|
||||
foreach (var l in ll) {
|
||||
for (var k = int.max(0, i - radius); k <= int.min(m - 1, i + radius); ++k) {
|
||||
if (k == i) continue;
|
||||
if (!arr2d_e[k, l]) {
|
||||
arr2d_e[k, l] = true;
|
||||
cell2scr(m, n, k, l, out cr[cci].scr_value_point);
|
||||
found = true;
|
||||
break;
|
||||
}
|
||||
}
|
||||
if (found) break;
|
||||
}
|
||||
if (found) break;
|
||||
|
||||
// left, right
|
||||
int[] kk = {int.max(0, i - radius), int.min(m - 1, i + radius)};
|
||||
foreach (var k in kk) {
|
||||
for (var l = int.max(0, j - radius); l <= int.min(n - 1, j + radius); ++l) {
|
||||
if (l == j) continue;
|
||||
if (!arr2d_e[k, l]) {
|
||||
arr2d_e[k, l] = true;
|
||||
cell2scr(m, n, k, l, out cr[cci].scr_value_point);
|
||||
found = true;
|
||||
break;
|
||||
}
|
||||
}
|
||||
if (found) break;
|
||||
}
|
||||
if (found) break;
|
||||
}
|
||||
}
|
||||
}
|
||||
}
|
||||
|
|
@ -518,12 +609,12 @@ namespace CairoChart {
|
|||
}
|
||||
}
|
||||
|
||||
protected virtual void calc_cross_sizes (Series s, Point128 p, out Point128 size,
|
||||
protected virtual void calc_cross_sizes (Series s, Point128 p, out Point size,
|
||||
bool show_x = false, bool show_time = false,
|
||||
bool show_date = false, bool show_y = false) {
|
||||
if (show_x == show_time == show_date == show_y == false)
|
||||
cross_what_to_show(s, out show_x, out show_time, out show_date, out show_y);
|
||||
size = Point128 ();
|
||||
size = Point ();
|
||||
string date, time;
|
||||
s.axis_x.print_dt(p.x, out date, out time);
|
||||
var date_t = new Text(chart, date, s.axis_x.font, s.axis_x.color);
|
||||
|
|
@ -535,8 +626,8 @@ namespace CairoChart {
|
|||
if (show_date) { size.x = date_t.width; h_x = date_t.height; }
|
||||
if (show_time) { size.x = double.max(size.x, time_t.width); h_x += time_t.height; }
|
||||
if (show_y) { size.x += y_t.width; h_y = y_t.height; }
|
||||
if ((show_x || show_date || show_time) && show_y) size.x += double.max(s.axis_x.font.hspacing, s.axis_y.font.hspacing);
|
||||
if (show_date && show_time) h_x += s.axis_x.font.hspacing;
|
||||
if ((show_x || show_date || show_time) && show_y) size.x += s.axis_x.font.hspacing + s.axis_y.font.hspacing;
|
||||
if (show_date && show_time) h_x += s.axis_x.font.vspacing;
|
||||
size.y = double.max (h_x, h_y);
|
||||
}
|
||||
}
|
||||
|
|
|
|||
|
|
@ -34,12 +34,12 @@ namespace CairoChart {
|
|||
/**
|
||||
* Vertical spacing.
|
||||
*/
|
||||
public double vspacing = 4;
|
||||
public double vspacing = 2;
|
||||
|
||||
/**
|
||||
* Horizontal spacing.
|
||||
*/
|
||||
public double hspacing = 4;
|
||||
public double hspacing = 2;
|
||||
|
||||
/**
|
||||
* Both vertical & horizontal spacing (set only).
|
||||
|
|
@ -51,7 +51,7 @@ namespace CairoChart {
|
|||
set {
|
||||
vspacing = hspacing = value;
|
||||
}
|
||||
default = 4;
|
||||
default = 2;
|
||||
}
|
||||
|
||||
/**
|
||||
|
|
@ -67,8 +67,8 @@ namespace CairoChart {
|
|||
Cairo.FontSlant slant = Cairo.FontSlant.NORMAL,
|
||||
Cairo.FontWeight weight = Cairo.FontWeight.NORMAL,
|
||||
Gtk.Orientation orient = Gtk.Orientation.HORIZONTAL,
|
||||
double vspacing = 4,
|
||||
double hspacing = 4
|
||||
double vspacing = 2,
|
||||
double hspacing = 2
|
||||
) {
|
||||
this.family = family;
|
||||
this.size = size;
|
||||
|
|
|
|||
|
|
@ -1,28 +1,46 @@
|
|||
namespace CairoChart {
|
||||
|
||||
/**
|
||||
* ``LabelStyle`` Style.
|
||||
* ``Cursors`` values style.
|
||||
*/
|
||||
public struct LabelStyle {
|
||||
|
||||
/**
|
||||
* Font style.
|
||||
*/
|
||||
Font font;
|
||||
|
||||
/**
|
||||
* Frame line style.
|
||||
*/
|
||||
LineStyle frame_line_style;
|
||||
public class LabelStyle {
|
||||
|
||||
/**
|
||||
* Background color.
|
||||
*/
|
||||
Color bg_color;
|
||||
public Color bg_color;
|
||||
|
||||
/**
|
||||
* Frame/border color.
|
||||
* Frame line style.
|
||||
*/
|
||||
Color frame_color;
|
||||
public LineStyle frame_style;
|
||||
|
||||
/**
|
||||
* Font style.
|
||||
*/
|
||||
public Font font;
|
||||
|
||||
/**
|
||||
* Constructs a new ``LabelStyle``.
|
||||
* @param font font style.
|
||||
* @param bg_color background color.
|
||||
* @param frame_style frame line style.
|
||||
*/
|
||||
public LabelStyle (
|
||||
Color bg_color = Color(1, 1, 1, 1),
|
||||
LineStyle frame_style = LineStyle(Color(0, 0, 0, 0.1)),
|
||||
Font font = new Font()
|
||||
) {
|
||||
this.bg_color = bg_color;
|
||||
this.frame_style = frame_style;
|
||||
this.font = font;
|
||||
}
|
||||
|
||||
/**
|
||||
* Gets a copy of the ``LabelStyle``.
|
||||
*/
|
||||
public virtual LabelStyle copy () {
|
||||
return new LabelStyle(bg_color, frame_style, font);
|
||||
}
|
||||
}
|
||||
}
|
||||
|
|
|
|||
|
|
@ -180,8 +180,8 @@ namespace CairoChart {
|
|||
switch (position) {
|
||||
case Position.TOP:
|
||||
case Position.BOTTOM:
|
||||
var ser_title_width = s.title.width + line_length;
|
||||
if (leg_width_sum + (leg_width_sum == 0 ? 0 : s.title.font.hspacing) + ser_title_width > chart.area.width) { // carry
|
||||
var ser_title_width = line_length + s.title.width + s.title.font.hspacing * 2;
|
||||
if (leg_width_sum + ser_title_width > chart.area.width) { // carry
|
||||
leg_height_sum += max_font_h;
|
||||
switch (process_type) {
|
||||
case ProcessType.CALC:
|
||||
|
|
@ -200,43 +200,43 @@ namespace CairoChart {
|
|||
|
||||
switch (process_type) {
|
||||
case ProcessType.DRAW:
|
||||
var x = legend_x0 + leg_width_sum + (leg_width_sum == 0 ? 0 : s.title.font.hspacing);
|
||||
var y = legend_y0 + leg_height_sum + mfh[heights_idx] / 2 + s.title.height / 2;
|
||||
var x = legend_x0 + leg_width_sum + s.title.font.hspacing;
|
||||
var y = legend_y0 + leg_height_sum + mfh[heights_idx] / 2;
|
||||
|
||||
// series title
|
||||
chart.ctx.move_to (x + line_length, y);
|
||||
chart.ctx.move_to (x + line_length, y + s.title.height / 2);
|
||||
chart.color = s.title.color;
|
||||
s.title.show();
|
||||
|
||||
// series line style
|
||||
chart.ctx.move_to (x, y - s.title.height / 2);
|
||||
chart.ctx.move_to (x, y);
|
||||
s.line_style.apply(chart);
|
||||
chart.ctx.rel_line_to (line_length, 0);
|
||||
chart.ctx.stroke();
|
||||
s.marker.draw_at_pos (Point(x + line_length / 2, y - s.title.height / 2));
|
||||
s.marker.draw_at_pos (Point(x + line_length / 2, y));
|
||||
break;
|
||||
}
|
||||
|
||||
switch (position) {
|
||||
case Position.TOP:
|
||||
case Position.BOTTOM:
|
||||
var ser_title_width = s.title.width + line_length;
|
||||
leg_width_sum += (leg_width_sum == 0 ? 0 : s.title.font.hspacing) + ser_title_width;
|
||||
max_font_h = double.max (max_font_h, s.title.height) + (leg_height_sum != 0 ? s.title.font.vspacing : 0);
|
||||
var ser_title_width = line_length + s.title.width + s.title.font.hspacing * 2;
|
||||
leg_width_sum += ser_title_width;
|
||||
max_font_h = double.max (max_font_h, s.title.height + s.title.font.vspacing * 2);
|
||||
break;
|
||||
|
||||
case Position.LEFT:
|
||||
case Position.RIGHT:
|
||||
switch (process_type) {
|
||||
case ProcessType.CALC:
|
||||
mfh += s.title.height + (leg_height_sum != 0 ? s.title.font.vspacing : 0);
|
||||
width = double.max (width, s.title.width + line_length);
|
||||
mfh += s.title.height + s.title.font.vspacing * 2;
|
||||
width = double.max (width, s.title.font.hspacing * 2 + line_length + s.title.width);
|
||||
break;
|
||||
case ProcessType.DRAW:
|
||||
heights_idx++;
|
||||
break;
|
||||
}
|
||||
leg_height_sum += s.title.height + (leg_height_sum != 0 ? s.title.font.vspacing : 0);
|
||||
leg_height_sum += s.title.height + s.title.font.vspacing * 2;
|
||||
break;
|
||||
}
|
||||
}
|
||||
|
|
@ -261,10 +261,10 @@ namespace CairoChart {
|
|||
case ProcessType.CALC:
|
||||
height = leg_height_sum;
|
||||
switch (position) {
|
||||
case Position.TOP: chart.evarea.y0 += height; break;
|
||||
case Position.BOTTOM: chart.evarea.y1 -= height; break;
|
||||
case Position.LEFT: chart.evarea.x0 += width; break;
|
||||
case Position.RIGHT: chart.evarea.x1 -= width; break;
|
||||
case Position.TOP: chart.evarea.y0 += height + spacing; break;
|
||||
case Position.BOTTOM: chart.evarea.y1 -= height + spacing; break;
|
||||
case Position.LEFT: chart.evarea.x0 += width + spacing; break;
|
||||
case Position.RIGHT: chart.evarea.x1 -= width + spacing; break;
|
||||
}
|
||||
break;
|
||||
}
|
||||
|
|
|
|||
|
|
@ -73,10 +73,9 @@ namespace CairoChart {
|
|||
line_style.color = value;
|
||||
axis_x.color = value;
|
||||
axis_y.color = value;
|
||||
axis_x.grid_style.color = value;
|
||||
axis_x.grid_style.color.alpha = 0.5;
|
||||
axis_y.grid_style.color = value;
|
||||
axis_y.grid_style.color.alpha = 0.5;
|
||||
axis_x.grid_style.color.red = axis_y.grid_style.color.red = value.red;
|
||||
axis_x.grid_style.color.green = axis_y.grid_style.color.green = value.green;
|
||||
axis_x.grid_style.color.blue = axis_y.grid_style.color.blue = value.blue;
|
||||
}
|
||||
default = Color (0, 0, 0, 1);
|
||||
}
|
||||
|
|
|
|||
|
|
@ -287,6 +287,7 @@ int main (string[] args) {
|
|||
da.set_events ( Gdk.EventMask.BUTTON_PRESS_MASK
|
||||
|Gdk.EventMask.BUTTON_RELEASE_MASK
|
||||
|Gdk.EventMask.POINTER_MOTION_MASK
|
||||
|Gdk.EventMask.SCROLL_MASK
|
||||
);
|
||||
|
||||
var chart = chart1;
|
||||
|
|
@ -571,11 +572,18 @@ int main (string[] args) {
|
|||
|
||||
return true; // return ret;
|
||||
});
|
||||
da.add_events(Gdk.EventMask.SCROLL_MASK);
|
||||
da.scroll_event.connect((event) => {
|
||||
switch (event.direction) {
|
||||
case Gdk.ScrollDirection.UP:
|
||||
chart.zoom_scroll_in(Point(event.x, event.y));
|
||||
break;
|
||||
case Gdk.ScrollDirection.DOWN:
|
||||
chart.zoom_scroll_out(Point(event.x, event.y));
|
||||
break;
|
||||
}
|
||||
da.queue_draw_area(0, 0, da.get_allocated_width(), da.get_allocated_height());
|
||||
|
||||
//var ret = chart.scroll_notify_event(event);
|
||||
|
||||
return true; // return ret;
|
||||
});
|
||||
|
||||
|
|
|
|||
Loading…
Reference in New Issue